 |
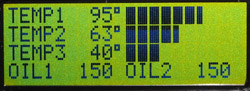
| Shows digital data and a 50-segment Bar Graph representing min (left) to max (right) sensor values. Up to 4 Bar Graphs can be configured per display page. Combine Bar Graphs and Digital Data readouts to easily compare values |
|
SeaGauge-X4 Specifications |
BarDisplay Example |
|
|
| Shows digital data and a 50-segment Bar Graph representing min (left) to max (right) sensor values. Up to 4 Bar Graphs can be configured per display page. Combine Bar Graphs and Digital Data readouts to easily compare values |
Home prices products order support contact
(c) Copyright 2006 Chetco Digital Inc. www.seagauge.com