 |
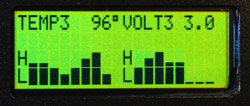
| Show gauge readings as they change over time. Two Histogram graphs can be combined on a single display page. Each Histogram has a 16-segment Bar graph for sensor value and a 8-segment history graph that is adjustable from 20 seconds to several hours. |