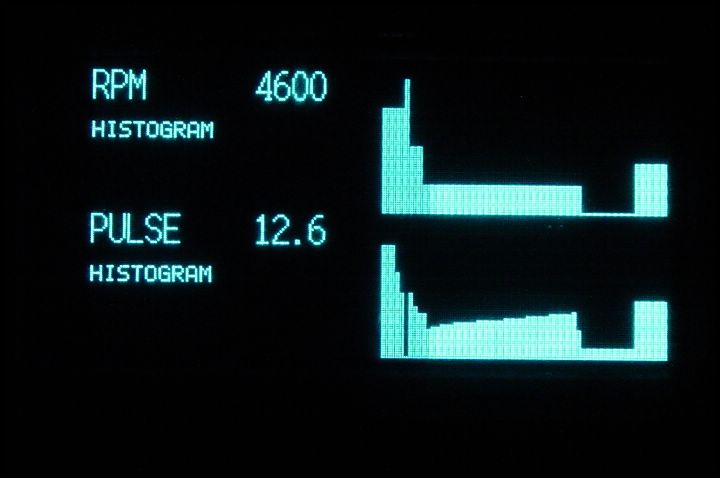
HISTOGRAM Screen 2
This screen shows 2 user defined Histograms, Each graph fills from left to right as new values arrive and older values are shifted right. As a result - the graph depicts sensor values over a user defined time period from several seconds to several hours. Bar Graph updates are in real-time. In this screen, RPM and Injector Pulse Width are being plotted with increasing RPM causing an increase in pulse width. Sensor values come from C950 via serial port.
info demo specs prices products order support contact
(c) Copyright 2005 Chetco Digital