|
|
|
|
|
|
|
|
|
|
|
SeaGauge-X4 Demonstration |
|
|
* To select the next gauge panel, click on the lower left button |
|
|
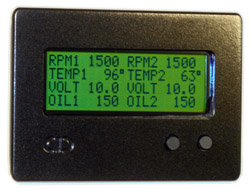
Data Display - Shows up to 8 digital gauge readings on one display. Text labels and positions are configurable using on screen menus. Show from 1 to 8 readings at a glance
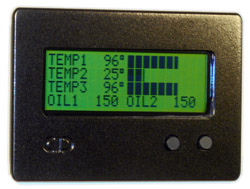
Bar Graph Display - Shows digital data and a 50-segment Bar Graph representing min (left) to max (right) sensor values. Up to 4 Bar Graphs can be configured per display page. Combine Bar Graphs and Digital Data readouts to easily compare values
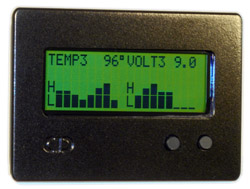
Histogram Display - Show gauge readings as they change over time. Two Histogram graphs can be combined on a single display page. Each Histogram has a 16-segment Bar graph for sensor value and a 8-segment history graph that is adjustable from 20 seconds to several hours.
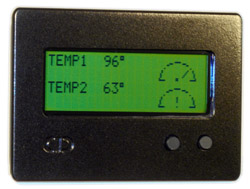
Gauge Display - A 5 segment Dial Gauge quickly shows relative sensor values from min to max. Up to 2 Gauge displays can be combined on single display page
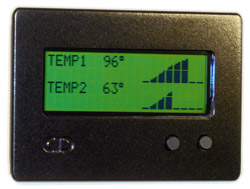
Ramp Display - Amplitude ramps show how close the sensor is to maximum. Combine up to two 8-segment sensor ramps per display page.