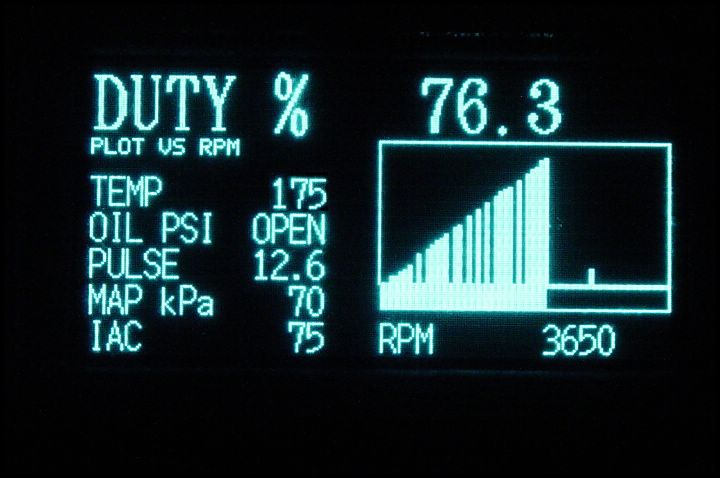
DUAL AXIS PLOT
This screen shows a plot of sensor values vs RPM. The RPM is plotted on the X axis while user defined sensor (Injector Duty Cycle) is plotted on the Y axis in real time. As RPM increases from left to right, the measured sensor value is plotted as relative amplitude. New values overwrite old values for the same RPM but are “frozen” once the RPM move on to another cell thus creating a history. The graph has 64 RPM cells from 0 to 7000 RPM. The graph can be cleared by selecting a new screen. Additional sensor values are shown on the left. This plot can be generated for MAP, SPARK, PULSE WIDTH, or any other user defined input. Sensor values come from C950 via serial port.
info demo specs prices products order support contact
(c) Copyright 2005 Chetco Digital