|
|
|
|
|
|
|
|
|
|
|
vGaugeG8 Demonstration |
|
|
* To select the next gauge panel, click on the lower left button |
|
|
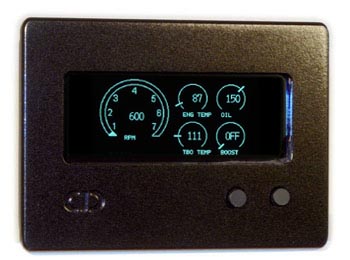
Gauge Display - A combination of large and small digital dial formats give a traditional look with digital accuracy. Displays can be mixed in any combination to provide just the right format
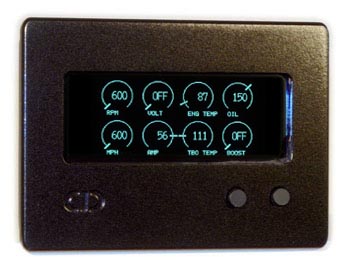
Dial Display - up to 8 small dials can be arranged to view important performance data. Each dial has a 16-segment outer needle which rotates around the perimeter while the center displays the digital read out of sensor data. A user defined sensor label is below each dial for easy identification.
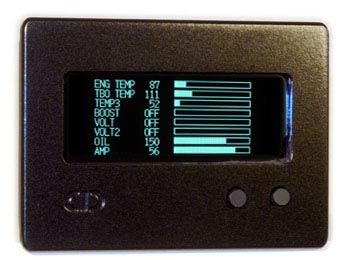
Bar Graph Display - Shows digital data and a 128-segment Bar Graph representing min (left) to max (right) sensor values. Up to 8 Bar Graphs can be configured per display page. Combine Bar Graphs and Digital Data readouts to easily compare values
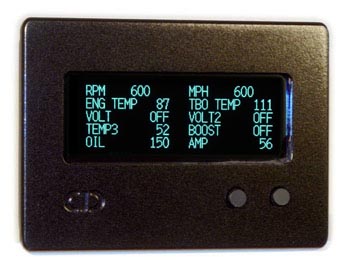
Data Display - Shows up to 16 digital gauge readings on one display. Text labels and positions are configurable using on screen menus. Show from 1 to 16 readings at a glance
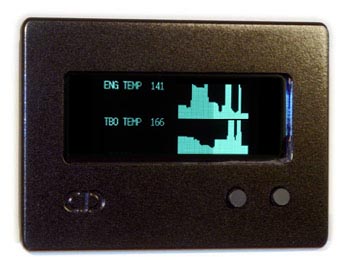
Histogram Display - Show gauge readings as they change over time. Two Histogram graphs can be combined on a single display page. Each Histogram has a 64-segment Bar graph for sensor value and a 128-segment history graph that is adjustable from 20 seconds to several hours.